

Why Past Performance is No Indicator of Future Returns
We’ve all heard the disclaimer “past performance is no indicator of future returns” thrown around or...

Chi Nguyen
December 9, 2021

Over the past few years, Kiwis have started to grasp the benefits of investing in low-cost index funds. We have joined a decades-long global trend that has fundamentally reshaped the way millions of individuals, advisers and pension schemes across the globe invest.
Estimates from the US show investors who shifted from high fee, actively managed funds to low fee index funds have saved over NZD$450b during the 23 years to 2018. And they are now saving over $30b a year in fees alone! This is an enormous transfer of wealth from the “industry”, back into the hands of the everyday investor.
Investors sometimes perceive that index funds, due to their broad diversification, are lower risk and therefore provide lower returns. Besides who just wants to be in the middle and receive an average return or slightly below as there are still some fees. So let’s have a look at the myth that index investors receive average returns or, after costs, below-average returns.
When Vanguard founder Jack Bogle launched the first retail index fund at the end of 1975, he was derided by the fund industry. Edward Johnson of Fidelity spoke for most active managers of that time when he said, “I can’t believe that the great mass of investors are going to be satisfied with receiving just average returns.” The fund was lampooned as “Bogle’s Folly” and was even described as “un-American”. Ironically, of course, above-average returns are exactly what index investors have received—and what most active investors have missed.
We all like to think that we’re better than average, that we can identify a better-than-average fund manager, or even select direct stocks that will outperform. Fund managers and researchers get paid big bucks to avoid the “bad” ones and find the “good” ones. But, in aggregate, average is what we are, and it’s what fund managers are too.
Nobel Prize-winning economist William Sharpe explained in his ground-breaking 1991 paper The Arithmetic of Active Management, the mathematical conclusion that the average index investor is guaranteed to earn higher returns than the average active investor.
How is this possible? Imagine the investing community is divided into active and passive investors. Before costs, the return on the average actively managed dollar will equal the return on the average index managed dollar. Why is this so?
Compared to the return of the collective market, the outperformance of above-average investors is offset by the underperformance of below-average investors. This is often referred to as “the zero-sum game”.
After costs, however, because active investing is more expensive than index investing, the return on the average actively managed dollar will be less than the return on the average index managed dollar. Therefore, the average active investor must underperform the average index investor.
Putting it another way, the average index investor must end up with higher-than-average returns, after costs!
Note what I said there. Not average returns. Not below average. Higher than average returns.
Sharpe wasn’t demonstrating a theory with large assumptions, instead his paper was based on simple arithmetic. “These assertions will hold for any time period. Moreover, they depend only on the laws of addition, subtraction, multiplication and division. Nothing else is required”.
How much higher than average can index investors expect their returns to be? It comes down to the difference between the costs of actively managed and index-based investment strategies. The more you pay for an actively managed fund, the lower your returns are likely to be.
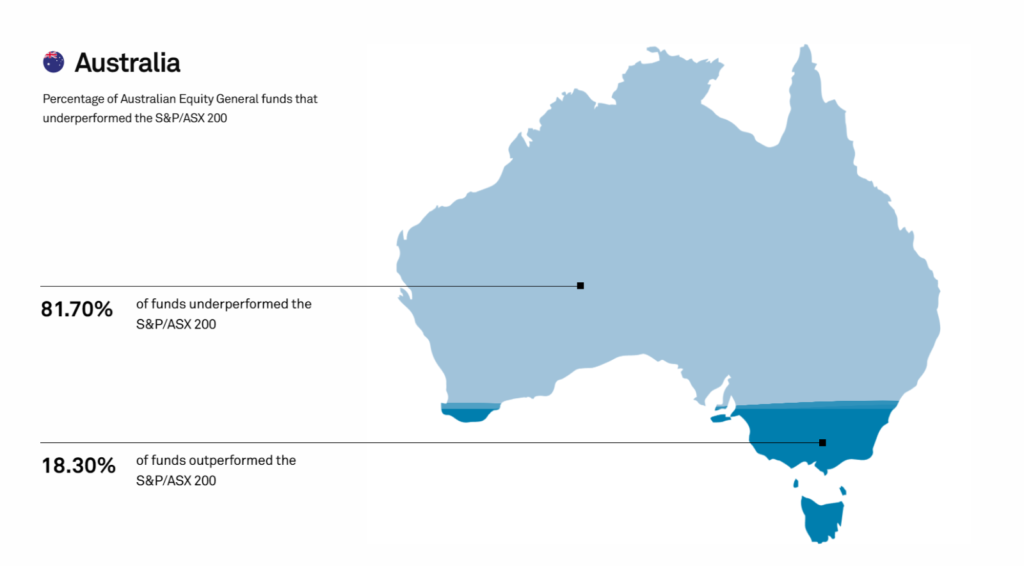
Since its first publication in 2002, the SPIVA Scorecard has served as the de facto scorekeeper of the active versus index debate. The latest results as at the end of 2020 showed that over a 5-year period, 81.70% of Australian equity funds underperformed the S&P/ASX200 index.
Similar results are seen around the world, with 75.27% of Large Cap US equity funds underperforming the S&P 500 index. When you look at the results over even longer investment periods, of 10 or 20 years, these numbers get worse, with often 85-95% of active funds underperforming the index.
Given costs are one of the reasons active funds underperform, is it better to just pick a handful of stocks directly?
There are thousands upon thousands of companies in the world for investors to consider. Surely researching through this list, you could build your own portfolio that will outperform. Only time will tell if your stock selection was a lemon or a huge winner.
However, like Sharpe, let’s look at the arithmetic of stock picking. If you had to guess what percentage of stocks outperformed the overall market, what number would you pick?
On first thought many will have guessed 50% – i.e. half of all stocks will outperform the market and half will underperform. Seems logical right? Unfortunately not – you may be surprised to know that the answer is not 50%.
The reason is that stock returns are not normally distributed (remember that nice looking bell curve from school). With stocks there is a “skewness” to the range of their returns. What does that mean exactly?
The graph below shows the total return of all New Zealand listed companies between Dec 2003 and Dec 2019 – a sum total of 16 years of return data.
Some key things to note here – the return on your investment in these companies can only go down so far; negative 100% meaning the company has gone bust.
The upside, however, is infinite; companies can go up in multiples higher than 100%.
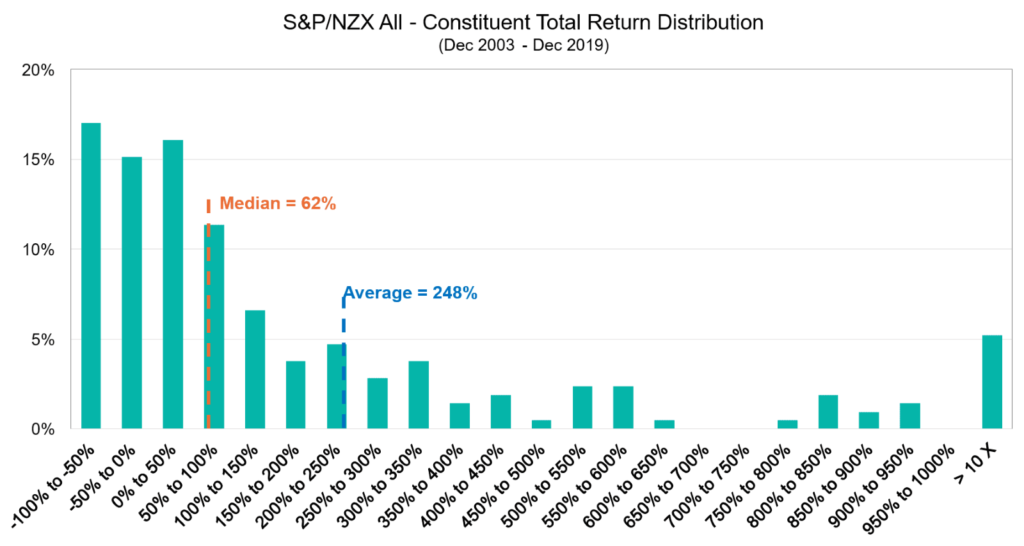
Source: S&P Dow Jones Indices
On the graph above the median line (62%) shows the return of the middle company, if all companies were ranked from best to worst performing. Half of all companies gave investors a return below this and half gave a return above this.
Had you picked any stock on the NZX back in 2003, you had a 50% chance of achieving a return below 62%*(to Dec 2019). However, over the period the average return was 248%.
That means a 50% chance of picking a stock that returned less than 62% AND well less than the average. The small 5% column on the far right is the percentage of stocks that delivered a 1000%+ return. It is this small number of stocks that is mainly responsible for pulling the “average” return up to 248%. It’s these few stocks that you really want to own – the trouble is identifying them in advance.
Could anyone have accurately picked back in 2003, which 5% of stocks would do so amazingly well over the next 16 years? No one, we repeat no one, can predict the future – our current world environment is a great example.
You have a 50% chance of picking a stock that performs below 62%, but what about the other 50%? From the data set, if you total the seven bars on the left, they add to roughly 75%.
This is significant because they are all the stocks that performed worse than the average. This means 75% of all stocks over the period performed worst than the average, therefore the odds are heavily stacked against you.
So next time you read about index investors receiving average or below-average returns, remember it simply isn’t true.
Active managers offer only the prospect, and a very faint one at that, of long-term outperformance. Only a tiny fraction of active managers beat the market over the long term on a cost- and risk-adjusted basis. The overwhelming likelihood is that if you invest in an active fund you will end up with lower net returns than if you in a low-cost index fund.
And picking stocks? Well, before you even get started the odds are heavily stacked against you that the stock/s that you select are likely to perform below average over the long term.
As Warren Buffett said in his 1993 letter to Berkshire Hathaway shareholders, “by periodically investing in an index fund… the know-nothing investor can actually outperform most investment professionals”.
So what are you waiting for?
Why Past Performance is No Indicator of Future Returns
We’ve all heard the disclaimer “past performance is no indicator of future returns” thrown around or...
Chi Nguyen
December 9, 2021

All You Need to Know About Investment Performance & Returns
Are my investments making money? An important question to know the answer to. We explain the nuances...

Catherine Emerson
May 14, 2020

A buffet(t) of historical performance
Buffett’s following is the stuff of legend and for good reason. However, the magnitude of Berkshire’...
Catherine Emerson
January 3, 2020
For market updates and the latest news from Kernel, subscribe to our newsletter. Guaranteed goodness, straight to your inbox.
Indices provided by: S&P Dow Jones Indices