
The data is in…and it’s the same old story.
For years active managers have claimed that anyone can ride the bull market and they will shine when things take a turn for the worse. The global shutdown in March presented the perfect case to test this claim, where the equity markets raced downwards before recovering.
When active managers claim ‘outperformance’, they are usually referring to a relevant benchmark. Benchmarks are assigned to funds on the basis that they have a similar asset allocation and the comparison is, in better words, ‘fair’. The goal for most active managers is to regularly outperform their respective benchmark, because it means they are finding higher than average value in the market.
How do their claims stack up?
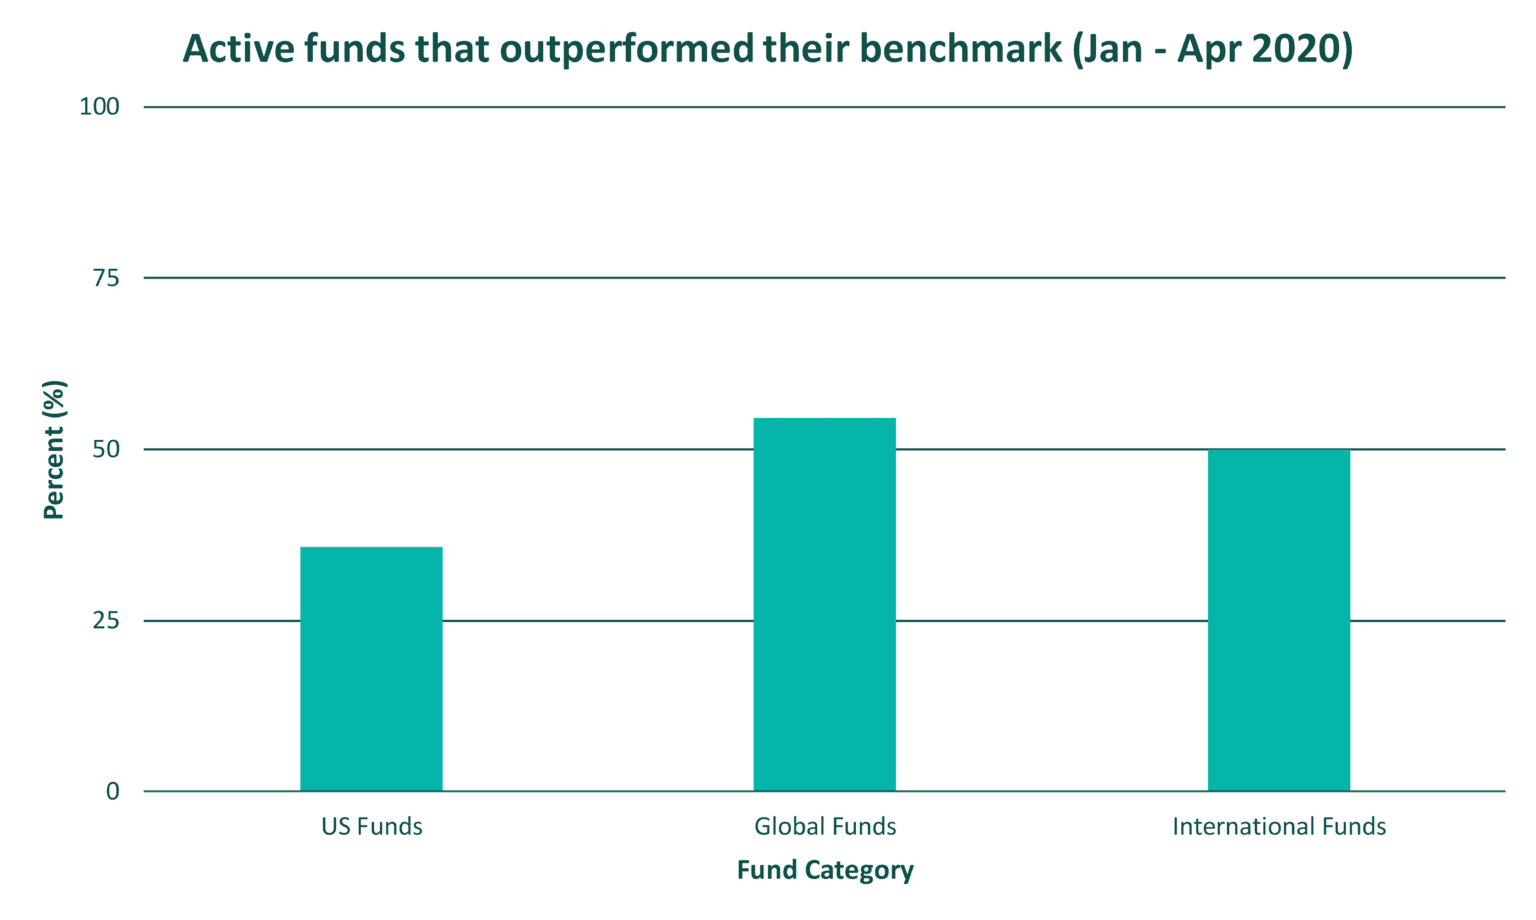
Unfortunately for active managers, the data simply doesn’t agree with these claims. Take a look at the chart below, where returns on global, international and US funds are analysed for the first four months of the year and compared to their relevant benchmarks.
Note that global funds are those which contain assets located globally, international funds are those which contain assets from at least two foreign countries, and US funds are those which contain assets only located in the United States.
Data Source: S&P Dow Jones Indices
Let’s analyse
For the four months from January to April this year, 54.6% of global funds outperformed the S&P Global 1200 benchmark and 50% of international funds outperformed the S&P International 700 benchmark. Faring worse, jut 35.7% of US funds outperformed the S&P Composite 1500 benchmark.
While the US funds performed poorly overall, the majority of global and international funds (albeit marginal in the latter case) outperformed the benchmark for the period where the markets most heavily reacted to the global shutdown…but is a slim majority enough?
This was the chance of a generation for active managers to prove their value, yet well less than half of US funds managed to do just that. That’s not the picture that has been painted by active managers for many years.
Even the fact that 54.6% of global active fund managers beat the benchmark isn’t convincing – if their value was true to their word, the number would be much higher.
Not convinced yet? Let’s look at the long term.
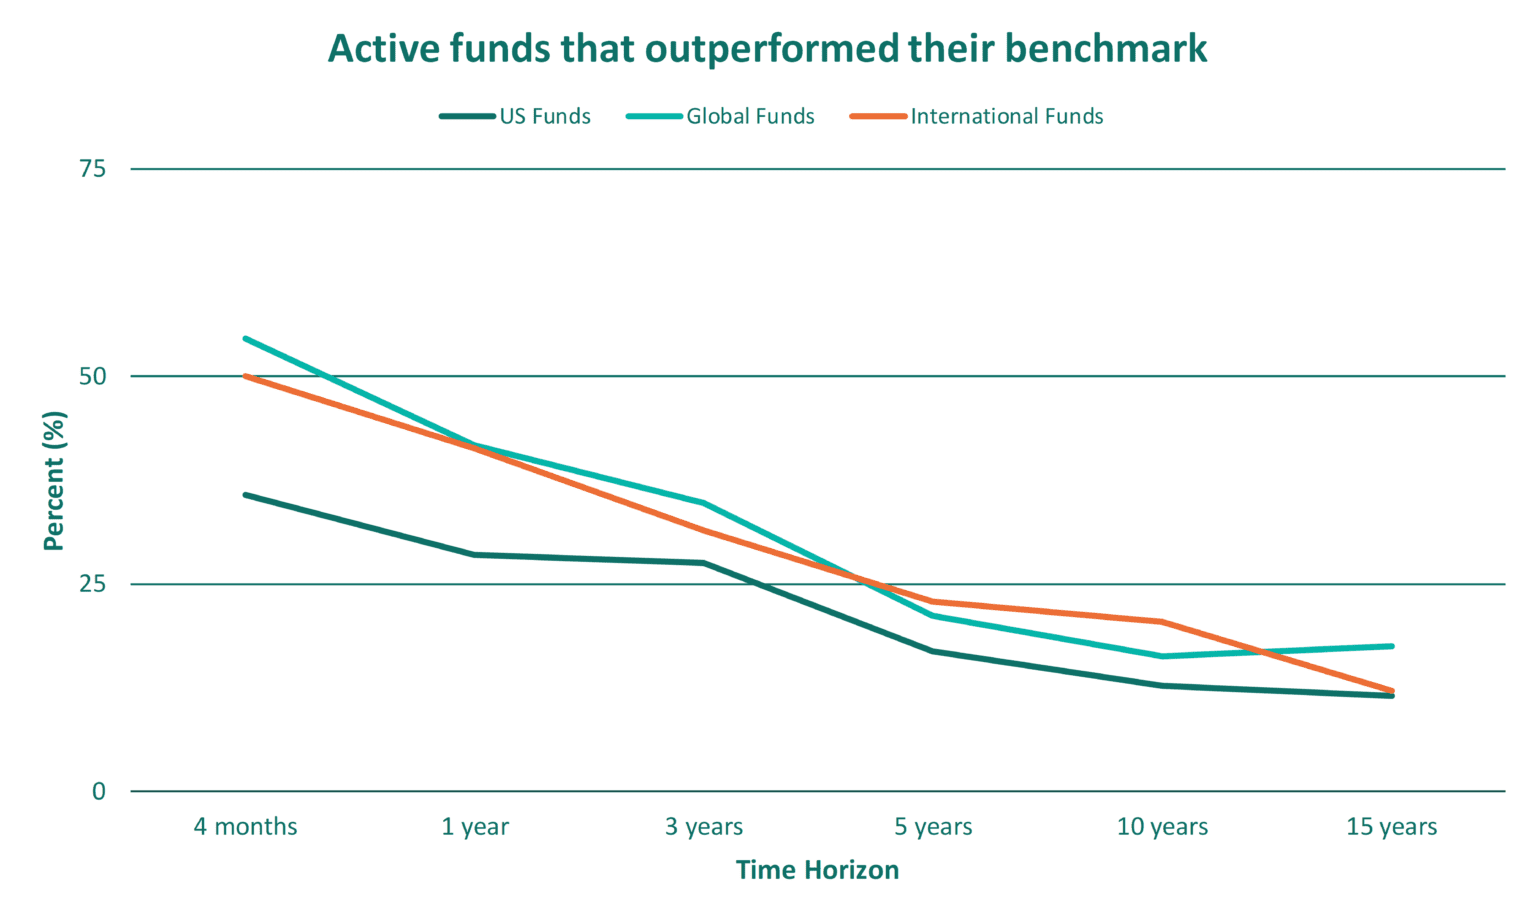
The likely critic of the above is that four months is not a long enough time period to draw conclusions, even though “bear markets” tend to last only months. The chart below shows the same markets as above, but for longer time horizons. There’s one key characteristic of all fund categories that is apparent here.
The longer that active funds try to outperform their benchmark, the worse they get at doing so. Often this can be because active fund managers fail to adapt their strategy to market changes over time.
Data Source: S&P Dow Jones Indices
Looking closer, over the last 15 years, roughly only 15% of global, international and US funds outperformed their benchmark.
This means that as an everyday investor 15 years ago, there was roughly an 85% chance that you would do better by investing in an index fund, than investing your money with an active manager (assuming only global, international and US funds were available). They are odds we would happily take.
It’s clear that the longer the time horizon of your investment, the higher the probability that an index fund will earn you better returns.
Follow the money
Fund fees are a beautiful little thing, because they tell you far more than you think. Due to the competitive nature of the fund management environment (with new managers appearing left, right and centre in recent years…including us!), a recent Morningstar report showed that US fund fees are almost half what they were 20 years ago.
This is because lower-fee index funds have become increasingly more popular and the competition has driven active fund managers to lower their fees…it makes you wonder why they weren’t that low in the first place?
This trend isn’t slowing down by the way. In 2019, the 20% of US funds with the lowest fees had net inflows of US$581 billion, while the 80% of US funds with the highest fees had net outflows of US$224 billion.
Essentially, investors are continuing to move to low-fee index funds, likely for two key reasons:
The funds cost far less to manage and thus the fees are lower, which has a compounding effect over the long-term. A small increase in how much of your returns you keep will make a big difference down the line!
Like the data showed in the long-term, the majority of active funds underperform low-fee index funds which replicate their benchmarks.
Although the popularity of index funds in New Zealand is not quite at the same level as seen overseas, we know the data about local active funds mirrors these trends. As Kiwi investors grow their investment knowledge, the shift away from high-fee, underperforming active funds is happening already…
So, what does this all mean?
When we tie all this information together, it tells us that the claim “active management shines in a bear market” simply doesn’t hold up. This isn’t to say that active management doesn’t have its place, because it certainly can in a core-satellite portfolio. However, for an everyday investor looking to save for the long-term, the data shows that on average, index funds are more likely to deliver better returns.
Want to know more about how an index fund works? Read more below.
