
If you’re interested in investing, you’ve probably been reviewing your options and may have come across index funds. It’s great if you have started reading about the benefits of index funds, their low fees and how to start investing. However, you’re probably still wondering “What is an index!?”
Enter that into Google and you will find the following definitions:
- (Publishing): An alphabetical list of something such as subjects or names at the back of a book, that shows on which page they are mentioned. Look up the term you want in the index.
- (Economics): A number that shows the price, value, or level of something compared with something else. A wage/price index.
- Something that can be used for measuring how a situation is changing. The Dow Jones index fell another 50 points yesterday.
Noun: index; plural noun: indexes; plural noun: indices
If you’re like us, you may regularly be reading interesting investment books such as ‘The Barefoot Investor’, or ‘Rich Enough?’ by local financial commentator Mary Holm, so you will be familiar with the first definition – the common index at the back of a book.
However, when you read definition 2, you may be feeling a little more perplexed. It’s fair to say it is not the most helpful definition. That’s why we created this guide, to break down the jargon and leave you feeling like an expert.
Note: this guide focuses on financial indices only, however you will be able to use this knowledge when you see any form of economic index referenced.
A brief history
Before we start breaking down the different types of indices, I want to take you back in time to where it all began.
For centuries we have had various forms of what we now refer to as the stock market. A common market place where people can buy and sell shares in a company. Throughout the day, the price of these shares move, driven by the buying and selling of each investor. After the market closes, journalists would cover the days activities and report on how the individual companies performed.
Before computing power and the advent of the internet, this was a manual and time consuming process which resulted in a lot of information for the end reader to digest.
Then, on 26 May 1896, two journalists, Charles Dow and Edward Jones, published the first stock market index. The Dow Jones Industrial Average. A single development that would go on to change financial markets forever.
Dow & Jones
Dow and Jones developed the index as a way to summarise the collective performance of the stock market for investors. The first contained 12 of the largest companies in each sector of the US stock market, with the first published index value of 40.94. The 12 companies that featured were:
- American Cotton Oil
- American Sugar
- American Tobacco
- Chicago Gas
- Distilling & Cattle Feeding
- General Electric
- Laclede Gas
- National Lead
- North American
- Tennessee Coal Iron & RR
- U.S. Leather
- United States Rubber
Today, the index has grown and now contains 30 companies listed on stock exchanges in the US, and finished 2019 with an index value of 28,538.44

What is an index?
An index is designed to measure the performance of a market, or a part of a market. It does this by calculating the collective price movements, and therefore performance, of the selected stocks that are within the index.
When an index is launched a starting value is set by the index provider. This can be any number, but let’s say 1,000. At the end of the day, the index provider calculates the collective performance of the companies in the index. Some may be up, and some may be down. As an example, let’s look at the S&P/NZX 20 Index. This index is designed to measure the performance of the 20 largest companies listed on the NZX (NZ Stock Exchange).
Let’s assume that as a group, the performance of the 20 companies combined for the day was 1%. The index value at the end of the first day will be calculated and will increase by 1% to 1,010.
Each day the value is calculated, and you can graph these daily values over different time periods to see how the market performed. In fact, thanks to advancements in technology indices are now calculated in real time throughout the day while the market is open.
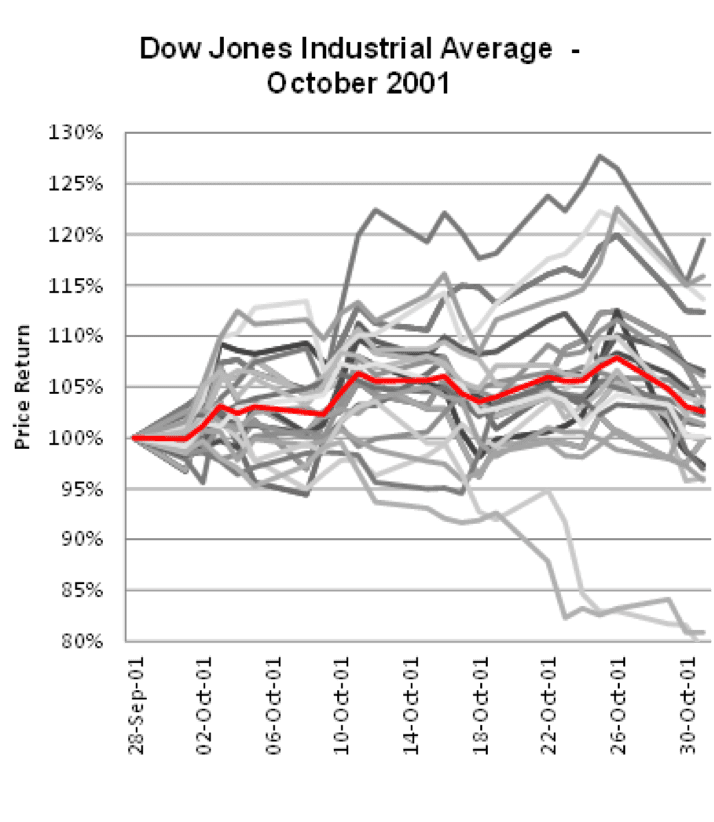
An example
Going back to the Dow Jones Industrial Average, we have graphed the performance of the index over a month. We’ve also graphed the performance of the 30 companies within the index (grey lines) over the same time period. As you can see, some companies have performed well and others…not so well. The index reports on the collective performance of these companies and in this particular month it finished up 3%.
Who’s behind the index?
There are a number of firms around the world that specialise in creating and calculating indices.
Three of the largest index providers are:
In fact, S&P Dow Jones calculate over 1 million indices each day around the globe.
A providers job is a crucial one, because financial professionals and investors worldwide depend on the indices to be accurate, for real time information about market performance and to make investment decisions.
To better understand what providers do, it can be helpful to consider what they don’t do:
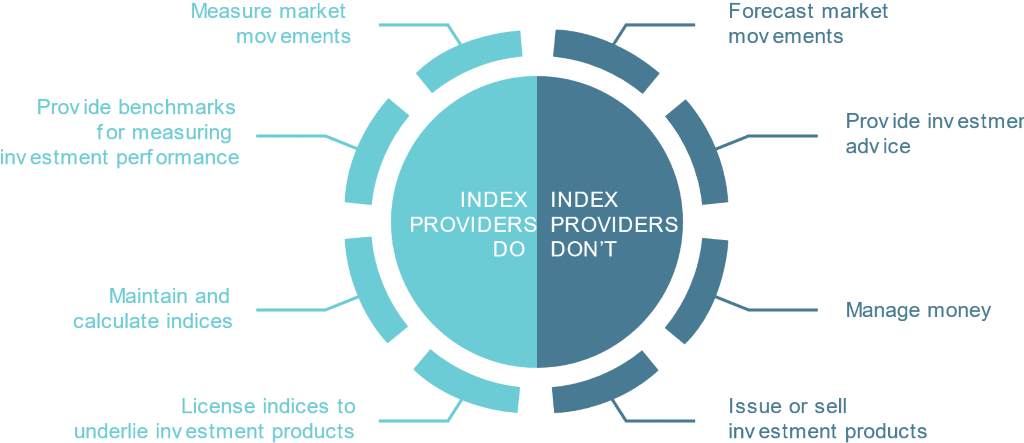
It is important the index providers are independent, given the role that they play in the market.
As a business, you can think of a provider like a software company, in that it creates specialised products and intellectual property (typically data), that is delivered digitally to their customers. And like a software company, a provider’s operations revolve around developing new products, licensing and distributing these products, and providing related service and support.
What types of financial indices are there?
Each index has a detailed methodology that the provider publishes and adheres to. The methodology is the ‘rule book’ for how the index is calculated, it details various rules such as what criteria companies need to meet in order to be included and how often the companies in the index are reviewed.
Two criteria that have a big impact on how an index is calculated are: how are the companies weighted and how many companies are included.
How are the companies weighted?
The Dow Jones Industrial Average, is market capitalisation weighted. The market capitalisation weighting was, and remains, the most common approach to constructing an index. These indices typically cover large and broad sections of a market, think the S&P 500 in the US. Under a market capitalisation weighting, the companies are weighted based on their size – the bigger the company, the bigger percentage weighting it has.
Looking at the S&P/NZX 20 index the weightings of the 20 companies, as at 31 Dec 2019 is:
Company | % at 31 Dec 2019 |
|---|---|
Fisher & Paykel Healthcare | 13.63% |
The a2 Milk Co | 11.81% |
Auckland Intl Airport | 8.86% |
Spark | 8.50% |
Ryman Healthcare | 7.25% |
Meridian Energy | 6.71% |
Contact Energy | 5.47% |
Fletcher Building | 4.52% |
Mainfreight | 3.84% |
Infratil | 3.55% |
Mercury NZ | 3.38% |
EBOS Group | 3.03% |
Chorus | 2.93% |
SkyCity Entertainment | 2.84% |
Port of Tauranga | 2.66% |
Goodman Property | 2.63% |
Kiwi Property Group | 2.62% |
Precinct Properties | 2.11% |
Z Energy | 1.88% |
Air New Zealand | 1.69% |
The largest company, Fisher & Paykel Healthcare has a current market capitalisation (value of the company) of $12.77b. This is bigger than the next largest company, a2 milk which has a market capitalisation of $11.12b. Therefore, it has a higher percentage weighting.
Equal weight indices
Another weighting method is equal weight. Equal weight indices are self-explanatory, all companies within the index have the same weight. A simple example, in an index that has 10 companies, each company would have a 10% weighting.
As technology and access to data has improved, indices have evolved. This lead to the development of factor indices, sometimes referred to as smart-beta indices. Under a factor methodology, companies are selected for inclusion based on a certain characteristic or pattern, rather than just picked based on sector or size. Examples of factor indices including value, low volatility, or high dividend indices.
Taking high dividend as an example, the index will select companies that have a shared characteristic – high dividends. Then, how does it weight these companies? It may weight them based on their size, using the market capitalisation weighting, or they may have a factor weighting. A high dividend index with a factor weighting may weight the companies by their dividend yield, i.e. the companies with a higher dividend yield have a bigger weighting.
How many companies are in the index?
There are two approaches, a fixed number of constituents or variable.
Fixed
A fixed constituent index will, typically, have a set number of companies. The S&P/NZX 20 index, that Kernel tracks with the NZ 20 fund, has as you probably guessed, 20 companies. It doesn’t matter if a company meets the other inclusion criteria of the index, they will only include a set number of companies.
Variable
Whereas the S&P Emerging Opportunities index, tracked by Kernel’s Small & Mid Cap Opportunities Fund, has a variable number of constituents. Companies are included so long as they meet the wider inclusion criteria detailed in the methodology. For example, minimum company valuation, liquidity of their shares and sector exposure.
Rebalancing
Once a methodology is in place, then it is important to know how often is the index re-assessed. It is common for indices to have a semi-annual or quarterly review, known as a rebalance.
At the rebalance, the constituents are reassessed to ensure they still meet the requirements for inclusion in the index. Continuing with the S&P/NZX 20, which has a fixed number of constituents and a quarterly rebalance, if a company has fallen in value since the last rebalance, it may be at risk of being replaced with a new company that has grown in value.
Who uses indices?
Lot’s of people! Financial institutions, advisers and even every day investors may monitor indices to track the health of a market. In the US, the S&P 500 is regularly reported as a key indicator of the economic performance of the wider US economy.
While active fund managers are at the opposite end of the investment spectrum to passive funds, they still regular use indices. An active fund manager will select an index that closely reflects the investment strategy they are implementing and use this to benchmark their performance (in our blogs we explain why active managers regularly underperform a benchmark). The requirement to benchmark may also be imposed by regulators. This is the case in NZ, where all fund managers are required to publish quarterly updates that detail their performance against an appropriate benchmark, along with investment holdings and fees.
As the benefits of passive funds have become more widely known, indices are increasingly licenced and used to form investment products such as index funds. At Kernel, we licence to use index data in order to operate our funds. The Kernel NZ 20 fund tracks the S&P/NZX 20 and every day we receive files from the index provider containing index data that we use to operate our funds.
Conclusion
So whether you are looking to track a market’s performance, evaluate your portfolio or invest in index-linked investment products, indices are indispensable financial tools, and the performance of different indices will impact your financial life in many ways.
