
Majority of Actively Managed Funds Continue to Underperform
Time and time again the data shows that actively managed funds result in underperformance compared t...

Dean Anderson
23 June 2022

S&P Dow Jones Indices recently issued their mid-year SPIVA® reports for the U.S., Australia, and Europe. Although one can sometimes find exceptions in the short run, the long-term results of SPIVA can be easily summarised:
The majority of active managers underperform most of the time.
Historical success does not predict future success.
SPIVA continues a line of inquiry that began nearly 90 years ago with the first study of active fund performance versus passive benchmarks. This work accelerated in the 1970s, as the growth of professional portfolio management drew increasing academic interest. Nobel laureate Paul Samuelson was representative of his contemporaries in suggesting that “most portfolio decision makers should go out of business.”
Active managers didn’t take kindly to Samuelson’s suggestion in 1974 and, despite the accumulation of confirming evidence since then, they don’t take kindly to it today either.
We’ve estimated that the cumulative cost savings to asset owners just from indexing the S&P 500, S&P MidCap 400, and S&P SmallCap 600 amount to better than $450 NZD billion.
Every dollar of costs saved by the investor is a dollar of fees not paid to an active manager. So while resentment is to be expected, it’s surprising that critics of SPIVA sometimes focus on its minutiae, rather than on its results.
The most important thing to realize about SPIVA results is that they are not a coincidence.
The active management community didn’t lose a cosmic coin flip 90 years ago; active underperformance happens for a set of readily identifiable reasons. These include:
Portfolio management is a zero-sum game; the only source of alpha for the winners is the negative alpha of the losers. When most of the assets in a market are professionally managed, the average professional won’t beat the market because the average professional is the market. It’s not a coincidence that the first index funds were launched in the 1970s; by that point the U.S. equity market had been largely professionalized.
The expense ratio of the average actively-managed equity mutual fund was 0.74% in 2019; the average index fund cost 0.07%. The average active manager therefore starts out 67 bps in the hole.
The distribution of stock returns is skewed—i.e., most stocks underperform the market average. Exhibit 1 illustrates this for the S&P 500.
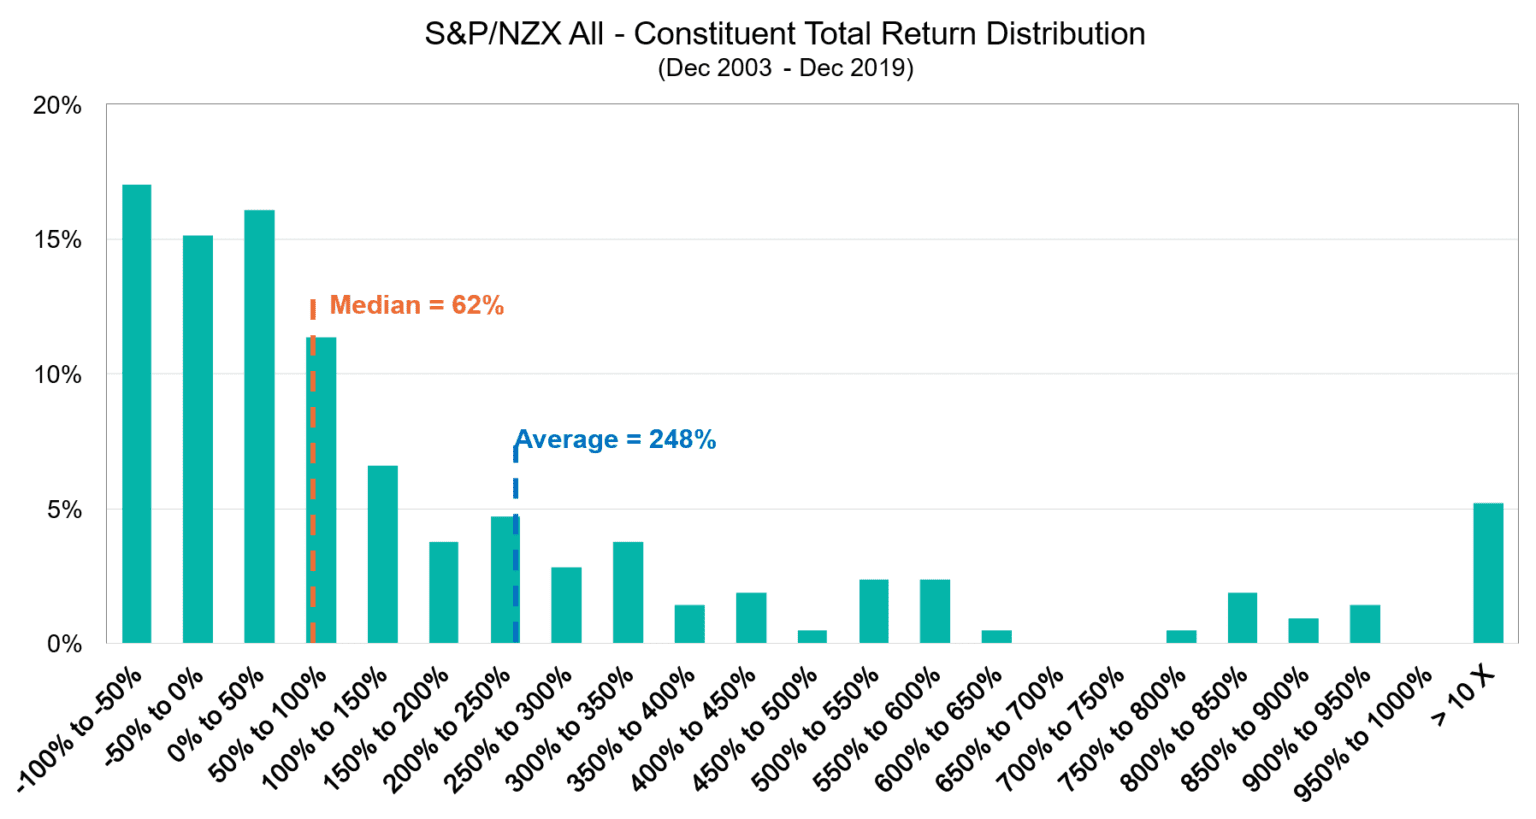
Of the stocks that were part of the NZX stock market between 2003 and 2019, few returned more than average. The probability that a randomly chosen stock would deliver above-average performance, in other words, was not 50%. When fewer stocks outperform, active management is harder.
These (and other!) reasons are robust and sustainable. Investment management will stay professionalized, active costs will always exceed index costs, and in most years most stocks underperform the average in most markets.
The index advantage is likely to persist.
This post was originally published by Craig Lazzara, Managing Director and Global Head of Index Investment Strategy at S&P Dow Jones Indices. It it re-published here with permission.
Majority of Actively Managed Funds Continue to Underperform
Time and time again the data shows that actively managed funds result in underperformance compared t...
Dean Anderson
23 June 2022

All You Need to Know About Investment Performance & Returns
Are my investments making money? An important question to know the answer to. We explain the nuances...

Catherine Emerson
14 May 2020

The Opportunity Cost of Savings
In the past year, the real return on a savings account has gone negative. So what's the opportunity ...
Dean Anderson
31 October 2020
For market updates and the latest news from Kernel, subscribe to our newsletter. Guaranteed goodness, straight to your inbox.
Indices provided by: S&P Dow Jones Indices