
Some people would argue that now is a pretty good time to buy some companies, but you might be wondering how to pick the best stocks. Whether you’re starting to invest or adding to your portfolio, choosing from all the thousands of companies in the world can be daunting. How do you know you’ve made the right choice? Only time will tell if your stock selection was a lemon or a 10 bagger.
So, what can we share to help make picking stocks less-hard? Let’s look at some history and real data.
Quiz time
If you had to guess what percentage of stocks outperformed the overall market*, what number would you pick?
Go on, have a guess!
On first thought you might have guessed 50% – i.e. half of all stocks will outperform the market and half will under perform. Seems logical right? Unfortunately not – you may be surprised to note that the answer is not 50%.
The reason is that stock returns are not normally distributed (remember that nice looking bell curve from school). With stocks there is a “skewness” to the range of their returns. What does that mean exactly? Read on for a simple and graphical maths lesson.
The simple maths lesson
The graph below shows the total return of all New Zealand listed companies between Dec 2003 and Dec 2019 – a sum total of 16 years of return data.
Some key things to note here – the return on your investment in these companies can only go down so far; negative 100% meaning the company has gone bust.
The upside, however, is infinite; companies can go up in multiples higher than 100%.
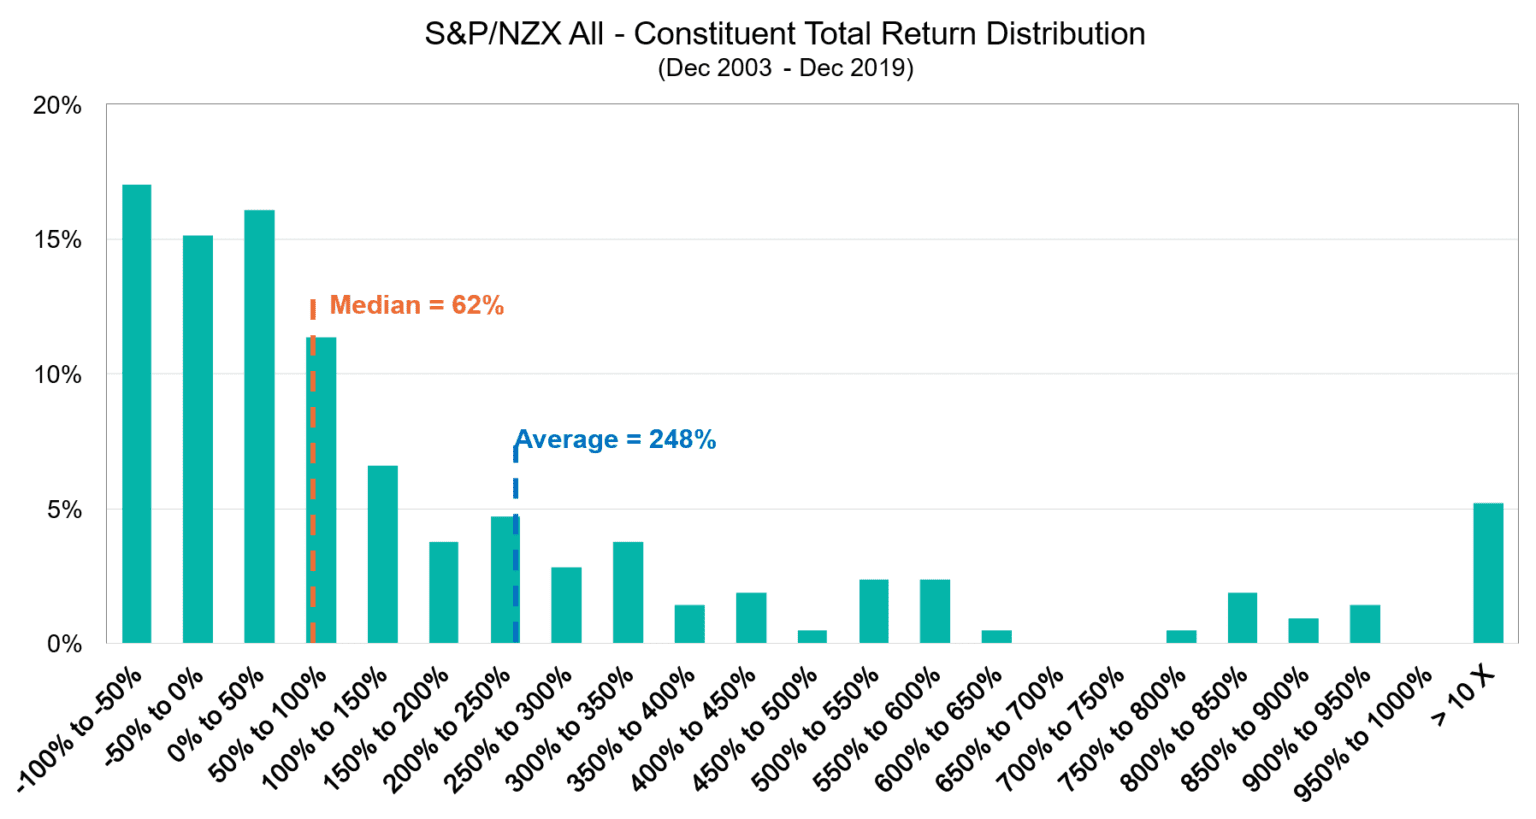
On the graph (above) the median line (62%) shows the return of the middle company, if all companies were ranked from best to worst performing. Therefore, half of all companies gave investors a return below this and half gave a return above this.
Had you picked any stock on the NZX back in 2003, as at Dec 2019 you had a 50% chance of achieving a return below 62%.
You don’t want the median
You might be thinking – hey, a 62% return sounds pretty good. We’ve got some news for you: over the period the average return was 248%.
So a 50% chance of picking a stock that returned less than 62% AND well less than the average. Yikes – it doesn’t sound so easy to pick a good stock.
What about the dazzling column on the far right…
The magical 10 bagger
That 5% of stocks has delivered returns of at least 1000% over the period and it is this small number of stocks that is responsible for pulling the “average” return up to 248%. It’s these few stocks that you really want to own – the trouble is identifying them in advance.
Could anyone have accurately picked back in 2003, which 5% of stocks would do so amazingly well? No one, we repeat no one, can predict the future – our current world environment is a great example.
But surely I can beat the average?
You have a 50% chance of picking a stock that performs below 62%, but what about the other 50%? From the data set, if you total the seven bars on the left, they add to roughly 75%.
This is significant because they are all the stocks that performed worse than the average. This means 75% of all stocks over the period performed worst than the average, so even before you go to pick one, the odds are heavily stacked against you.
So what should you do?
Make sure you get your share of that 5% of stocks! AND without having to trust someone to be prophetic.
How? Own every single stock. That way, you’re guaranteed to own a portion of those golden 10 baggers. How does one buy every single stock, without trading like a maniac and incurring all the brokerage costs?
They own the market through a diversified index fund. If you do this, you will get the market return – that lovely average figure. Not less, not closer to 62% or worse, like so many investors.
So remember:
How many stocks would a smart investor own if a smart investor could pick stocks?
All of them.
