

Demystifying Index Fund Returns
Some investors perceive index funds to be lower risk and therefore provide lower returns. But is thi...

Dean Anderson
12 July 2021

We’ve all heard the disclaimer “past performance is no indicator of future returns” thrown around or reinforced by financial providers (ourselves included!). But what does this statement actually mean? And why is it that it stands true? Let us explain.
Research has shown that a strong skill of humans is the ability to detect patterns, even in randomness. It allows us to predict and expect what might come next and to complete a picture in our heads. And when these patterns are found, we tend to believe in them. Though this genetically hard-wired behaviour is an essential part of how we learn and make decisions, it is the reason behind one of the most common biases in the investment world – “trend-chasing bias”.
It is the tendency to buy assets with good past returns and sell assets with poor past returns. An important part of trend-chasing bias is the belief that what has happened in the past will continue to do so.
Other cognitive biases, such as “illusion of control” – the belief that we have more control over events than we actually do – and “confirmation bias” – the tendency to notice and focus on evidence that supports our existing beliefs – may also reinforce trend-chasing behavior by causing us to overestimate the role of skill and downplay the role of luck in predicting random events such as stock price movements.
Although financial products often come with the disclaimer that “past performance is no predictor of future results”, we still believe that we can predict the future by studying the past. The irony is that this “herding” can extend the trend as enough people acting based on the trend and following the actions of others, will continue the trend.
So when we see charts like the ones below, we assume the future will continue and our brain draws the dotted line.
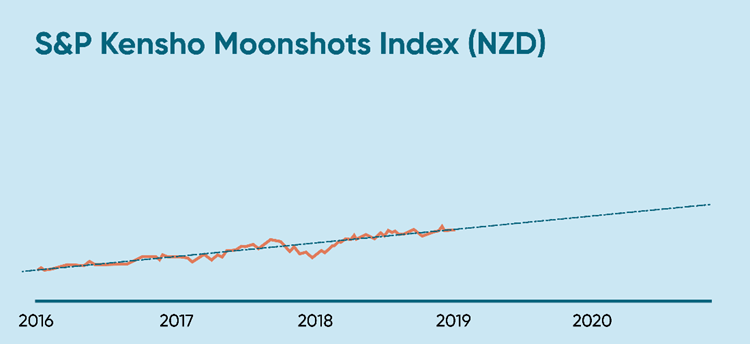
Figure 1 – Performance three years to 31 December 2019: 31.17% per annum.
However, if you roll through the slides, showing the performance of the index of the Kernel Moonshots Fund, you will see that returns vary substantially and far more random than we could predict.
If we look at the following figures, showing the performance of the index of Kernel Moonshots Fund, you can see that returns vary substantially and far more randomly than observing a trend could predict.
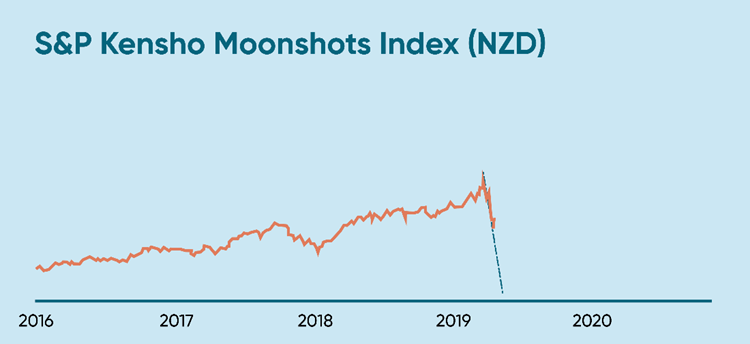
Figure 2 – Covid-19 and the March 2020 stock market crash: the index went down 22.12% from 31 December 2019 to 18 March 2020.
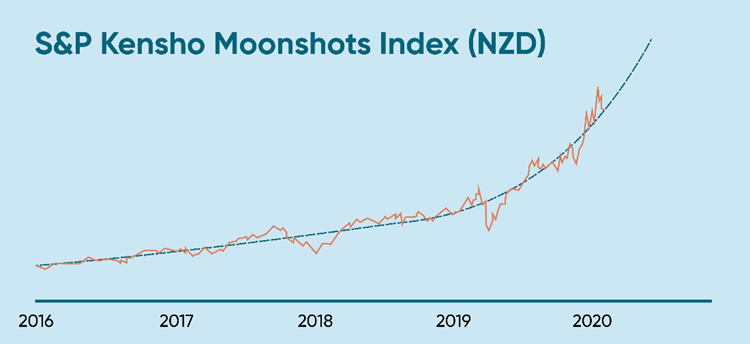
Figure 3 – Performance 1 year to 31 December 2020: 107%
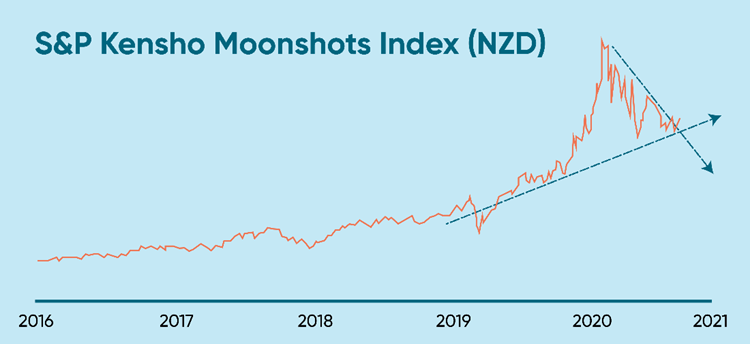
Figure 4 – Performance six (three) months to 31 August 2021: -18.27% (-2.17%).
Using only historical returns to make investment decisions can never be a successful long-term strategy.
A stark example is the dot-com crash in the early 2000s. From the mid-1990s onward, investors started to speculate on Internet companies even though many of them had yet to ever make a profit. The focus was on their potential for great things and assumptions of adoption and expansion.
Chasing the price trend, investors simply believed that if they bought shares in a dot com company, the price would go up. However, when the Tech bubble ‘burst’ between 2001 and 2002, a lot of these Internet companies went out of business. Even the surviving ones took a huge hit. To put this in context, Amazon’s share price fell by over 90% from its peak in April 1999.
Even worse, understanding that individual and inexperienced investors are likely trend-followers, some product issuers advertise aggressively on the investments that have done well in the past to attract investors. A simple google search of “investment returns” will find multiple companies advertising “high investment returns” to entice you in.
Market movements (and therefore trends) are far more random than most of us care to admit. When you identify a trading pattern, it’s highly likely that the pattern has already been identified and taken advantage of by other market participants such as institutional investors. So, focusing on that identified trend will carry the risk of buying at the market peak.
Before we tell you what to look at, it’s important to remember that past excellent or poor returns do not necessarily mean that the performance will persist over your investment horizon. You can expect there to be bumps along the road, but it doesn’t mean these indicate a trend to the moon or the graveyard. With that in mind, here are a few key indicators that you might find helpful when making an investment decision:
Before making any investing decisions, sit down and take a comprehensive look at your current financial situation. Whether you’re investing towards a first home deposit or to build up your retirement nest egg, it’s important to understand what your money is invested for, as it will help you identify when you’ll need all or some money back (your investment horizon).
The purpose of knowing your investment time horizon is to land on a suitable asset allocation. Some investments are more suitable for longer time horizons as you can afford to ride out the market fluctuations when there is more time remaining, whereas other investments are more suitable for the short-term, because the stability is more important.
All investments are associated with some degree of risk, meaning accepting the possibility of losing some (or if undiversified, all) of your money. The reward for taking on an additional level of risk is the potential for a greater investment return.
The understanding of your personal tolerance for risk matters since it helps you stay within your comfort zone when making an investment decision and ideally sticking to it when adverse conditions exist. Many factors can go into identifying the level of risk tolerance, for instance:
(i) the length of time that you can wait for the potential losses to recoup,
(ii) future earning capacity, and;
(iii) the stability of your current and future income sources, or other existing financial and real estate assets.
You know the saying; Don’t put all your eggs in one basket. Consider diversifying your portfolio across markets, sectors and stocks. Doing so can help protect against significant losses.
During a particular period of time, favorable market conditions can be in some countries but not in the others. Similarly, market conditions that cause some sectors to perform poorly don’t necessarily cause other sectors to suffer negative returns. Hence, diversification helps reduce the risk of making a loss overall.
If you’re still wondering how, investing in a well-diversified index fund can be a good start. Using a core-satellite investing strategy can be a way to still pick some companies that you believe have great prospects for the future that investment professionals have not yet realized, or allowed for.
Do be aware of false diversification, as when products (e.g. ETFs or index funds) overlap, it can increase not reduce the concentration. More funds is often always better.
Many investors often rely on past returns to choose individual stocks or funds. What they often overlook is the volatility of the returns. To make a well-informed investment decision, you should be able to know whether it’s worth taking on an additional level of risk (higher volatility of returns).
What do we mean by this? Let’s take a look at an example…
Let’s suppose you have two funds. Over the trailing 10-year period, fund A earned an annualized return of 6% while fund B gained an annualized return of 12%. Over that same period, the standard deviation of fund A’s returns was 8% while that of fund B was 15%.
So, on the total return basis, fund B outperformed fund A, but when the volatility of fund’s returns – as measured by standard deviation – is taken into account, it is still the case?
Some of the most common methods to measure risk-adjusted returns – or returns per unit of risk taken – are Sharpe ratio and Sortino ratio. Sharpe ratio is calculated by taking the fund’s returns minus a risk-free rate, which is the return that you could get from a virtually free of risk investment such as 90-day bank bill rate (for instance 1.5% p.a.), and dividing by the standard deviation.
Here is the Sharpe ratio for the two funds:
Fund A: (9%-1.5%)/8%=0.94
Fund B: (12%-1.5%)/15%=0.70
When checking the performance through the Sharpe ratio lens, you get a better return per unit of risk with fund A. One of the drawbacks of Sharpe ratio is that it treats upside and downside variations as “equally risky”.
As such, Sortino ratio comes into play. The only difference between the Sortino ratio and Sharpe ratio is that the denominator of the Sortino ratio is the standard deviation of returns below the mean. And similarly, the higher Sortino ratio, the better, meaning that an investment is earning a higher return for each unit of downside risk.
Consistent with the start of this article, a significant drawback is that like past returns, past volatility is no indicator of future volatility, but a factor to consider. Using the Moonshot fund illustrated above as the example, for the period 2017-2019 the annualized volatility was 23%, but rose in 2020 to be 45%.
Both an index fund and an actively managed fund should have their returns measured against their benchmark. Why? Because we need this piece of information to evaluate if fund managers are doing what they advertise and the fees that you are paying to fund managers are fair or too expensive. In essence, are you getting bang for your buck?
While many active funds do not disclose the benchmark that they use to measure their “alphas”, you can easily find the information regarding the benchmark index and the tracking difference of an index fund in the fund fact sheets or the Statement of Investment Policy Objectives (SIPO).
You could also proxy a major index as a broad benchmark, but funds that target or mainly hold smaller or younger companies should be compared to something appropriate, like a Small Cap Index or even the Moonshots index, rather than the Dow Jones Industrials, S&P500 or MSCI ACWI.
For an index fund manager, one of the key roles is to track the index as closely as possible. Hence, the tracking difference – the difference between the fund’s and index performance over a given period – should be small. By contrast, active fund managers charge customers higher fees and aim to outperform their chosen benchmark.
To understand whether it’s worth paying higher fees, you should be able to access both fund performance and benchmark performance. It should also be a red flag if an active fund manager cannot publish how they choose or construct their benchmark.
While tracking difference reflects the performance gap between the fund and the benchmark, tracking error measures the volatility of the return difference between the fund and the benchmark. In fact, tracking error is the standard deviation of the tracking difference over a time period.
Because it shows the volatility of the fund manager’s ability. For index fund managers, it’s the ability to track the index as closely as possible. For active fund managers, it’s the ability to consistently outperform the benchmark. In both cases, a fund with a higher level of tracking error is riskier.
At Kernel, we publish these numbers in fund fact sheets after our funds have a year’s worth of performance. You can check out an example here.
Investing is a ‘zero sum game’. In aggregate, investors can only earn the market return and with increasing professionalism in the markets, the chances to be above average after fees and transaction costs are consistently proven in independent research to be low.
Since they tend to charge relatively high fees, active fund managers very often underperform index fund managers when their fees are taken out especially over longer time periods.
Remember, any fees that you pay compound to eat up your returns over time.
If you want to invest in an index fund in NZ, it’s also important to understand the difference between an unlisted index fund and an Exchange Traded Fund (ETF). For an ETF, besides the management fees paid to fund managers, there will be other trading costs incurred when buying and selling units, including brokerage commissions, bid/ask spread, and foreign exchange fees. Therefore your actual performance will be less than the published, even before considering the personal impact of tax.
By comparison, with unlisted index funds you can buy or sell the units directly with the fund manager. With Kernel funds this means zero transaction costs. For investors contributing modest amounts regularly to a portfolio, these transaction fees can make a large difference on the total cost of ownership.
Moreover, listed investments in New Zealand are not as tax efficient as some unlisted investments, particularly with relation to unclaimed tax credits, and automatic taxation of fund distributions at the highest tax rate (28%). You can read more on the intricacies here.
There is no empirical evidence that an individual investor can time the market and consistently benefit from buying high and selling low. Yet there’s a plenty of research showing that making investment decisions based only on past returns does more harm than good to your wealth in the long run.
That doesn’t mean you should totally ignore it, however if you’re wondering which alternative indicators to look at we have suggested eight things to consider when choosing your investments.
Demystifying Index Fund Returns
Some investors perceive index funds to be lower risk and therefore provide lower returns. But is thi...
Dean Anderson
12 July 2021

What is Compounding – The Investment Concept you Need to Know
As an investor, compounding is actually your best friend and you can use it to your advantage. We ru...

Catherine Emerson
29 October 2019

One of the key roles an index manager has is to track the index as closely as possible. So, investor...

Stephen Upton
21 August 2020
For market updates and the latest news from Kernel, subscribe to our newsletter. Guaranteed goodness, straight to your inbox.
Indices provided by: S&P Dow Jones Indices